And by now…I mean like 5 months ago. But no matter, I’m finally getting around to telling you about it in some manner that might be noticeable. Or even semi-formal.
But wait – what’s the DCR Analyzer?
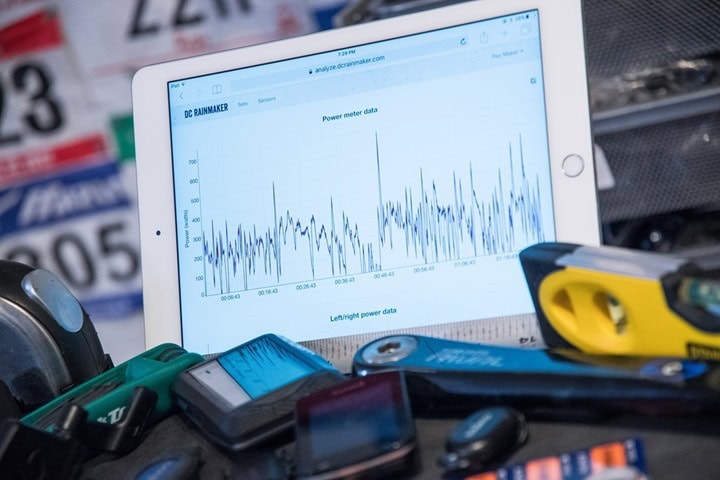
You know in my in-depth reviews (you do read those, right?) where I’ve got all these fancy charts that compare one power meter to another (or 4 others)? Or one heart rate strap to another or three? Or possibly one GPS track to 7 others? Well, that’s the DCR Analyzer.
It’s a purpose built tool that I’ve been using for almost two years now, designed specifically for comparing two theoretically like things. So how does one power meter track against another on the same ride. Or how does one optical HR sensor compare to a heart rate strap. That’s the goal.
It originated from my frustration with spending 15-45 minutes per ride/run/activity trying to normalize and compare the data using off the shelf tools. I used to use a combination of Golden Cheetah, Excel, and a large hammer to make everything work. The problem was that no tool exactly fit what I needed. And with a typical in-depth review having anywhere from 10-30 sets of data contained within it, it became a nightmare to quickly generate the core data that the reviews are often based around.
Hence…the DCR Analyzer was born!
I worked closely with a developer (of FitFileTools.com) to inch our way towards a pretty sweet toolset for comparing data from the same activity. And early last year (2016) a smattering of you started beta testing it as well. Then earlier this past year (January 2017) I opened the doors to anyone who wanted to use it.
Since then, far more of you than I ever expected have been making comparative data sets and seeing how your devices measure up. It’s been really cool to see! Especially cooler to see it being used throughout the industry, and even some of the UCI World Tour Pro Cycling teams are now using it for analyzing and validating data.
Now there are free options out there to do similar things. But there are a bunch of nuanced reasons why I feel the DCR Analyzer is better suited for data comparisons:
– Automatic Alignment: It automatically aligns files based on GPS timestamps (or any timestamps). So you don’t have to worry about pressing start at the same time, or about pauses
– Data file support: It doesn’t barf on files with the latest data types. Many 3rd party tools have trouble with file format specs that are updated with new data types. Since I use the tool on usually unreleased products, I get these supported in the Analyzer well before you even know the products exist.
– Sensor support: The DCR Analyzer allows you to save your sensors and then automatically recognize them for .FIT files. This is great if you record lots of things at once and accidentally mix up which unit recorded which.
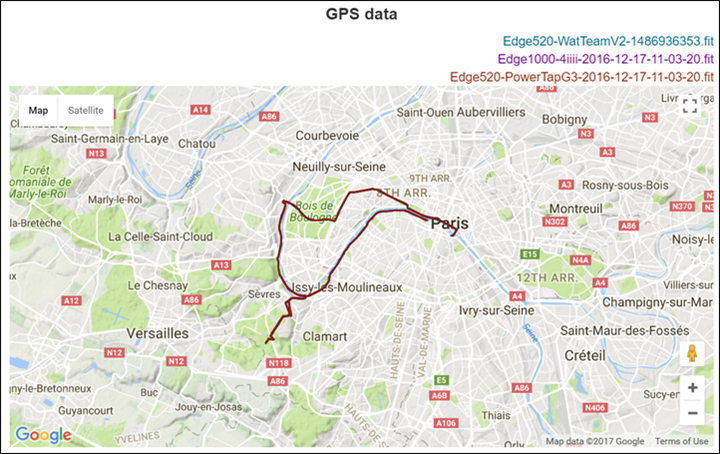
– Proper mapping: The ability to get true 1-second recording data tracks on the map is really important to me. A lot of sites/tools won’t properly display all the data points on the GPS map, which sorta defeats the purpose for analysis reasons.
– Constant improvements: We’re super open to adding features that make comparative analysis quicker and easier. I’ve got lots of ideas for how to keep improving the suite of tools for this purpose – without losing sight of the fundamental purpose: Comparing data files
– Data Types: It supports comparing a slew of data types: Heart rate data, Power meter data, Cadence data, Elevation data, Distance data, GPS Tracks
Now, to be clear – this is NOT a training log site. It’s not designed to replace sites like Training Peaks, Strava, SportTracks…or apps like WKO+ or SportTracks. Rather, it’s simply a tool to compare multiple sensors/tracks/whatever’s on the same activity. I still use all those tools myself as my training log. The DCR Analyzer is more like a graphing calculator than logbook.
So how do you get started? Well, there’s two options. First is a day pass, and then an annual pass. The day pass gives you 24 hours to create up to 3 sets of data (each set contains multiple files), and then you’ve got indefinite read-access after that. This is great if you’ve got a quick one-time use for it. This is $5.
The second option is the all you can eat annual pass. This allows you to create unlimited sets for an entire year. All 365 days of it! This costs $29 for the year, and like the day pass, your sets remain active indefinitely, even beyond your membership.
You can hit the account creation page here!
No matter which option you choose you can share the sets with public links, just like I do in my reviews (and you can also keep things totally private too). With public links you can post links to forums or e-mail, Snapchat or on a giant sign by the side of the road. Whatever floats your boat.
If you want to check out more about all the technical capabilities of it, you can read-up on the manual of sorts that I’ve put together here. This covers how to use the Analyzer, and some of my pro tips for analyzing hundreds of data sets with it.
With that – thanks for reading- and enjoy!


