Earlier this week Xert rolled out a new Connect IQ app. Now I don’t normally cover too many Connect IQ apps. In fact, I think I’ve only covered maybe 2-3 ones in total so far as standalone individual posts go.
Still, this one is interesting as it serves as a look into their training platform that I wrote about a few months back. I see their platform as a very viable competitor to Training Peaks (for cyclists anyways), and this free little app is an interesting way to get your FTP value without having to do an FTP test. And what’s even cooler? It shows your FTP in real-time as you ride.
What is FTP though? It’s your Functional Threshold Power, or roughly considered the maximum power you can maintain in an all-out effort for one hour (where you fall over and die at the end). This can then be used in training and racing strategies, primarily around pacing or the ability to sustain an effort for a given amount of time.
There are many ways to test this, including simply going all-out for an hour (and again, dying). But most coaches and training guidance has folks doing variants of 20 minute tests and then doing some math from that.
The challenge with either of those options is that they tend to take ‘away’ a day from training. Sure, sometimes you can work it into a schedule – but if you do a legit FTP test – that can be a pretty big stressor on a schedule, especially in-season (and far more so for triathletes balancing swim/run workouts too).
That’s why a number of paid training platforms have shifted to having algorithms that can determine your FTP by using just your day to day workouts. Training Peaks (on WKO4), TrainerRoad, Zwift, Xert, and others all do this today. It allows you to see how your day to day training or racing is impacting your FTP. Which in turn allows you to adjust pacing strategies.
Getting it installed:
Getting the ‘What’s my FTP app’ installed is pretty easy. It’s actually technically not an app, but rather a Data Field. But that’s actually kinda good, because it makes it easy to add to existing data fields.
For reference, this specific app is compatible with all of the following Garmin Connect IQ capable devices:
Garmin Edge 520/820/820 Explore/1000/1000 Explore
Garmin Forerunner 735/920/935
Garmin Fenix 3/3HR/5/5S/5X/Chronos
(Preemptive “Why doesn’t it work on the Vivoactive HR or FR235?” answer: Because those devices don’t support power meters, which this requires. As for why it’s not compatible with Epix? Because then Epix owners wouldn’t get the chance to punch themselves in the balls once again.)
Note that the app does require a power meter to function, since that’s a core piece of understanding and utilizing FTP in training/racing. Without a power meter, knowing your FTP wouldn’t be terribly useful.
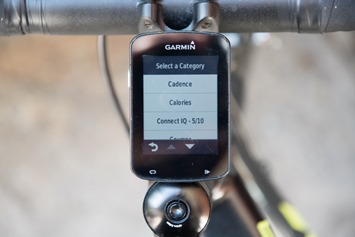
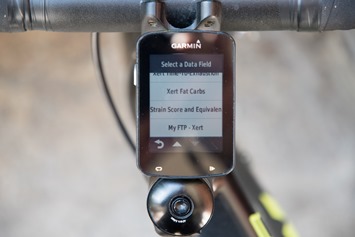
In any event, once you’ve downloaded/sync’d it to your device (via Garmin Express on desktop, or Garmin Connect Mobile on your smartphone), then you’ll go ahead and add the data field to an existing data page, or create a new page. Xert suggests also putting something like 3-second or 10-second power on that page, and I would agree. For the purposes of this post and ensuring the biggest possible gauge for photos, I just gave it its own page.
Note that you can tweak whether to show your FTP as wattage (i.e. 305w), or to show as watts/kilogram (w/kg). That’s done via the settings on the CIQ app. In my case, I just went straight wattage.
With that, you’re done in prep. Time to ride.
A Test Ride:
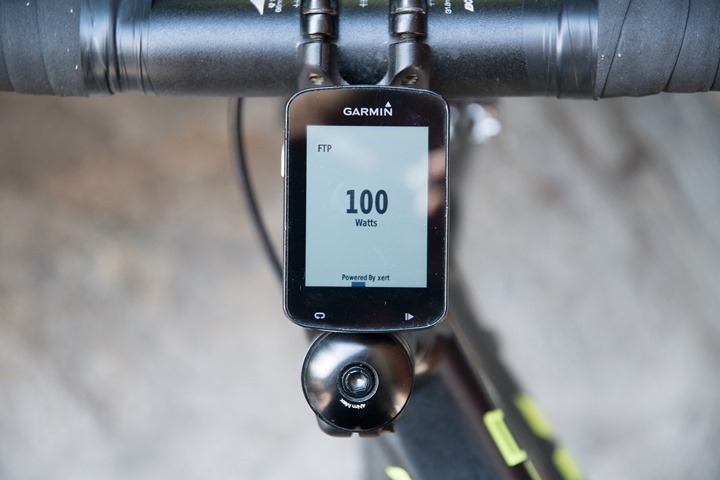
With my ride started the app will begin at a baseline FTP of 100w. If you’re FTP is below 100w…well…keep training?
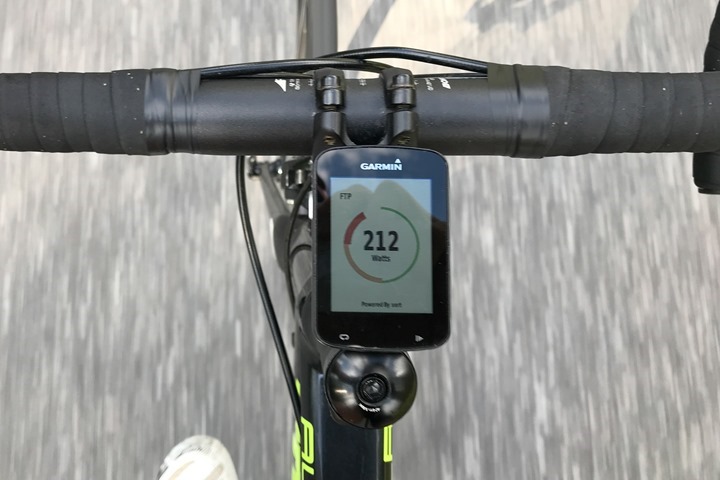
Within less than 60 seconds of just cruising out of town the FTP gauge was steadily climbing past 150w. Then, a few minutes later, at 212w:
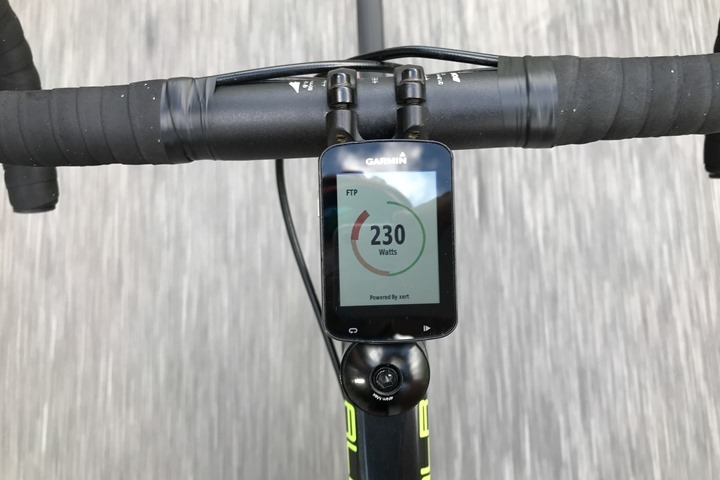
Then I decided to do a little sprint. Not an all-out effort sprint, but just a measured increase in intensity. The gauge quickly ramped up to ~230w. The time between the photo above and below is only 36 seconds, less time of which was sprinting.
Of course, FTP isn’t measured based on how much you can sprint, but the numbers there are a good indicator of it. And something that’s important to note here. This isn’t just a maximum power gauge, but rather is using Xert’s algorithms that look at duration of your ride and the length of these surges to determine FTP. I’ve covered how that works on their full Xert Online site in my previous post on them.
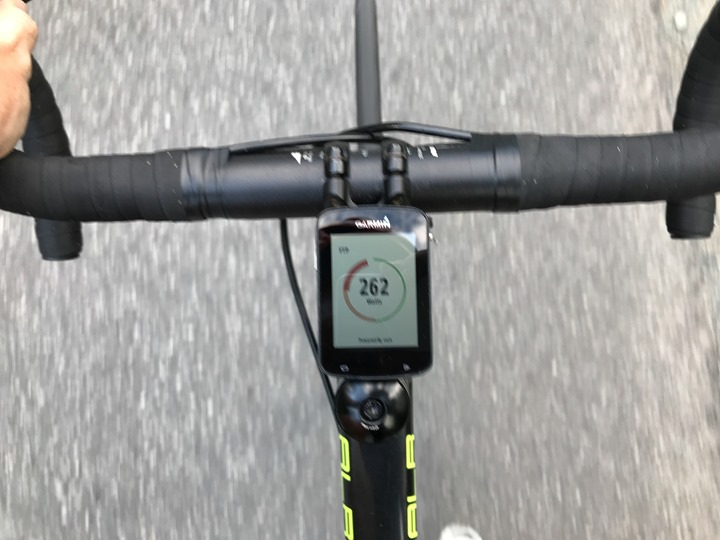
I kept on climbing up the hill/mountain/whatever and my numbers kept slowly climbing to about 260w, before mostly settling out. This makes sense – I wasn’t doing anything that would ‘show off’ in terms of wattage, so it had no other knowledge of what I could do. Remember that an FTP test is effectively about showing the best you can do, so in some senses you need to at least put in a hard effort somewhere (however brief) for Xert to do the same.
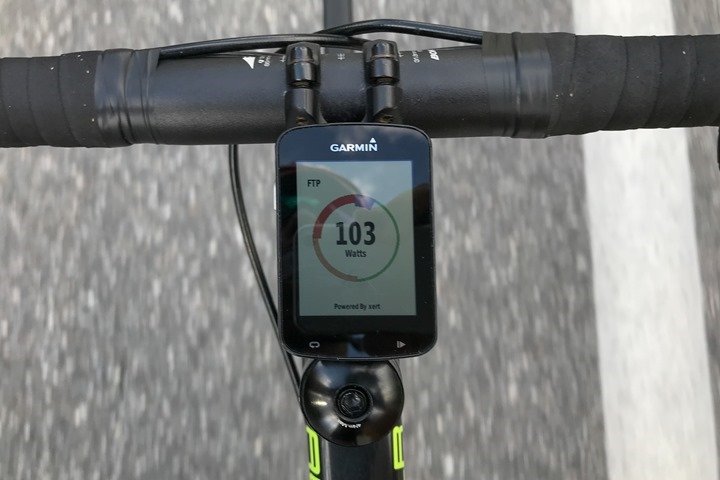
So I did that. While doing some very nice climbs up to the top of this pass in the French Alps, I threw down some wattage. Each time I did so I got nice solid bumps to my FTP. More interestingly the little color gauge around the number changed and increased. When I was in the red zone I’d be slowly increasing my FTP. Whereas when I crossed into the purple zone (effectively from 12’oclock and beyond, overlapping green), I’d quickly increase my FTP.
Here’s roughly what the colors mean:
Green: Less than 50% fatigued
Yellow: less than 75% fatigued
Red: Greater than 75% fatigued
Purple: Greater than 100% and FTP should go up
So essentially, when you hit purple the algorithm is re-adjusting itself because you’ve out-done yourself.
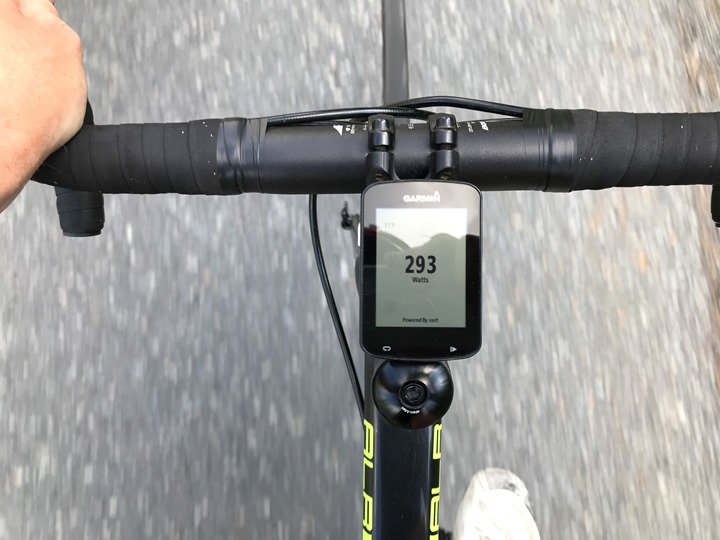
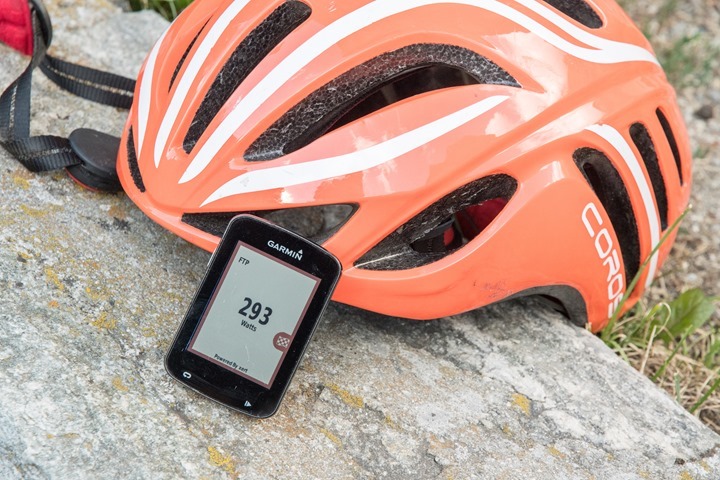
I did this 3-4 times in total, and it finally settled on 293. In talking with Xert, they note that doing an all-out sprint for about 2 minutes (far longer than I did in a single go), will get you very close to your FTP value in one shot.
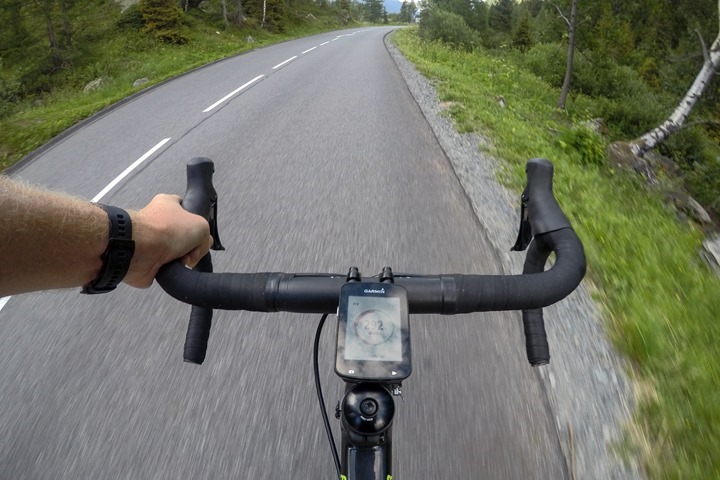
Note that when I descended, the little gauge settled back down color-wise into the green zone (barely visible on the photo below due to the reflection), which basically means I’m not making any progress towards increasing my FTP value shown (of course, I could be doing other perfectly functional training things). It’s also a reflection of me being happy I’m not having to peddle any longer.
So with the gauge saying my FTP was 293w off of a single 75ish minute test ride (with no painful FTP testing included), how close to that is reality?
Well, first, let’s look at the paid Xert online subscription service, which has *all* my data from the past year or so, thus it’s more all-knowing about what my capabilities are. After this ride, it predicts my FTP at 294w. Note that the new data field app does not talk to Xert online and has no knowledge of my other rides. It’s in a bubble. So that data field is predicting 293w.
Thus a 1w different. That’s pretty damn close.
But how close to that value do I feel reality is? Also pretty damn close.
Generally speaking depending on how much cycling I’ve been doing my FTP tends to float over the course of the season between 285w and 315w. This is also what most apps tend to put me in, again, dependent on how much training I’ve been doing.
Wrap-up:
So all in all – pretty darn cool.
I think that’s interesting/unique here is really the real-time FTP portion. Certainly some of Garmin’s own devices do actually give you FTP values at the end of rides. But I find this algorithm consistently under-estimates my FTP, and tends to require much more successive days of high intensity rides to get anywhere near my FTP – and even then, it’s usually below. But again, that’s upon completing the ride. Same goes with other training suites like WKO4.
Whereas here it’s the fact that I’m getting FTP feedback in real-time that’s so unique here. I can go out for a ride and start to see these values formulate as I’m giving hard efforts. No waiting hours, or even minutes later. I’m not aware of any other platform or app that does that.
Finally, one minor note is that you can use the lap button to reset the values. Inversely, if you use the lap function…beware it’ll reset these values by default. But you can turn this off in the options of the app.
Of course, the goal of this free app is largely to get you interested in their more advanced analytics platform. Which is kinda a neat way of utilizing the Garmin Connect IQ app platform. Many other premium apps (including Xert’s other CIQ apps) require subscriptions to those platforms, but tossing a few apps out into the marketplace to give folks a taste of what’s available is definitely a worthy strategy for other platforms to consider.
With that – thanks for reading!


