The list of companies aiming to get into running efficiency products seems to grow by the week, and this week I’m giving you a look at FeetMe. At its core, FeetMe is a connected insole that broadcasts and records everything from pace to cadence, and vertical oscillation to running power. Except that unlike other devices on the market, they are going a bit deeper in the metrics offered, and is also capturing those measures using force sensors – versus just accelerometers. The goal for FeetMe, like most other companies, is simply to ‘enhance performance’ and ‘avoid injuries’. But their technologies seem to be more advanced than most others in the market – and they’ve got a fairly grounded medical device history to support some of their accuracy claims.
As many know though, I’m a bit skeptical when it comes to some of the running efficiency focused products out there today. Not so much because I have questions on the underlying data (though I still do), but because I question how much study has been given to the guidance some of these products make. Still, I’m happy to evaluate them individually based on their merits.
Being a Parisian based company, I had the chance to take a pair of the insoles out for some quick demo runs to understand how they work. Afterwards, I poked around the app to see how the data looked. Let’s dive into it.
An Overview:
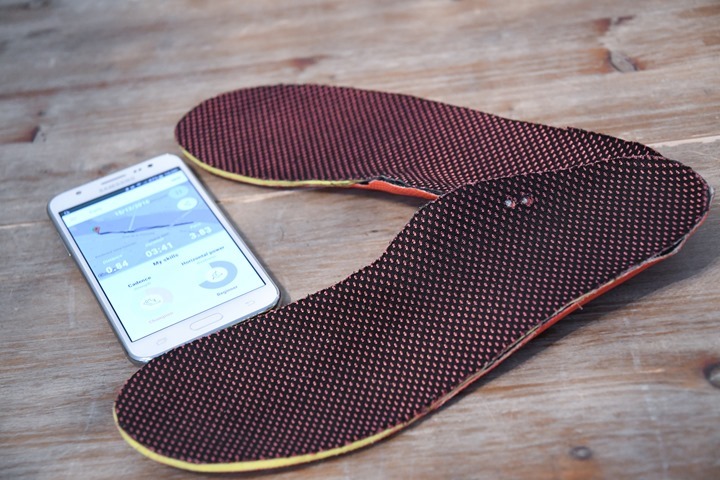
The FeetMe system is a pair of insoles covered in pressure sensors that have a surprising amount of tech packed into them. Unlike other insole systems I’ve seen/tried, the FeetMe doesn’t have additional pods hanging off the side – everything is instead internal. So with that in mind, it’s somewhat impressive that it contains all of this inside each insole:
– Concurrent ANT+ & Bluetooth Smart connectivity
– Battery and data storage for up to 25 hours
– Wireless charging (yah!)
– 25 pressure sensors covering the entirety of the foot
– 9 axis IMU (Inertia Measurement Unit): Accelerometer, gyroscope, magnetometer
– Waterproof (exact IPX rating not yet finalized)
The entire package weighs 80g per insole, which didn’t feel too much heavier than my other insoles.
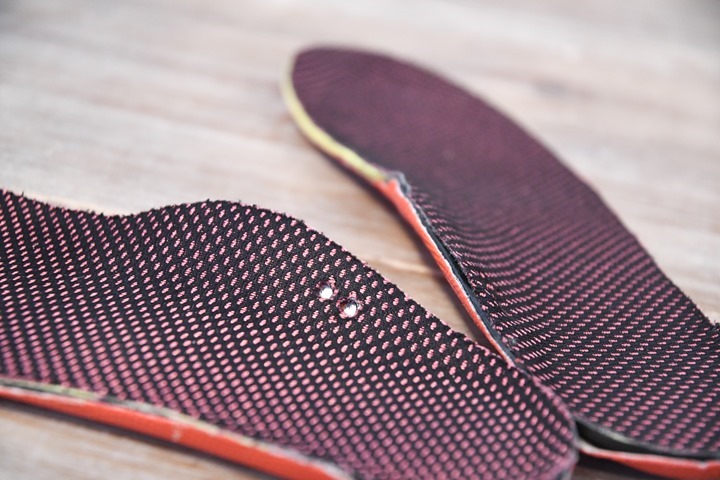
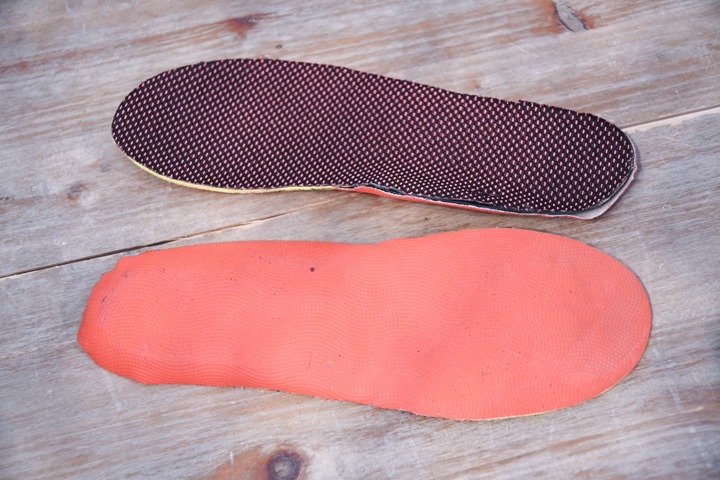
Their main selling point though is really their sensor design. Some other products will have 2-3 sensors in the insole, but this has 25 – covering virtually the entire insole and thus foot. It’s that additional sensor coverage that’s allowing them to dive more deeply into running power, and even cover areas such as horizontal versus vertical power. Of course, when you look at the insole from the outside – it looks just like any other insole.
On these prototype insoles there are two connector ports that you can see up above, enabling diagnostic and related beta functions.
What’s interesting here is that the company isn’t new to the insole space. In fact, their first product was focused on the medical side of the equation (called FeetMe Diagnosis). That product is used for post-surgery assessment and patient analysis. So this is really them porting over the technology into a new application (hence the slight product name shift from FeetMe Diagnosis to FeetMe Sport).
When it comes to data, today that’s transmitted via Bluetooth Smart to the mobile app. Or it was when I ran with it last month. Since then they’ve made progress and the data is actually recorded within the pods themselves and then downloaded after the fact. But you can run with the app in real-time too. Your choice.
As some of you probably noticed, the company is also transmitting data over ANT+. The plan there is twofold. First, it’s to allow your ANT+ enabled device (i.e. a Garmin watch) to pick up footpod data like cadence and pace. Secondly, it’s to enable transmission to a Garmin Connect IQ app that they’re working on – which will capture more of the running efficiency metrics than the standard footpod data.
Though, it won’t feed into Garmin’s Running Dynamics metrics, because Garmin still locks that down to just themselves. This is yet another example of a company trying to do running efficiency and wanting to enable the exact same metrics (Vertical Oscillation/Ground Contact Time) to show up natively on Garmin devices. Others stuck in Running Dynamics purgatory include Wahoo Fitness with their TICKR HR straps as well as Stryd with their running power meter.
A Run and The Data:
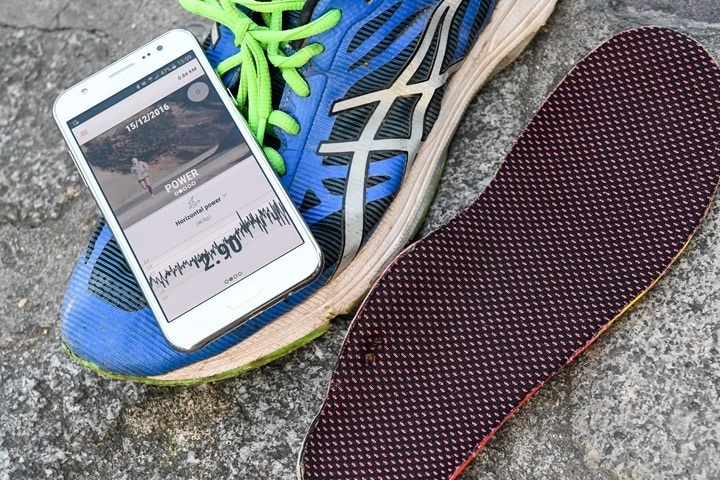
With the basics understood it was time to head out for a brief run to check things out. The focus wasn’t so much duration for my run, but just understanding the data it collects and how it all works. First up was sticking the insoles in my shoes. I simply removed my existing insoles and plopped these inside. That is a notable difference to something like Kinematix, which slides under your existing insoles (allowing you to keep them). On the flip side, Kinematix has a large pod hanging off the side, and this has none of that.
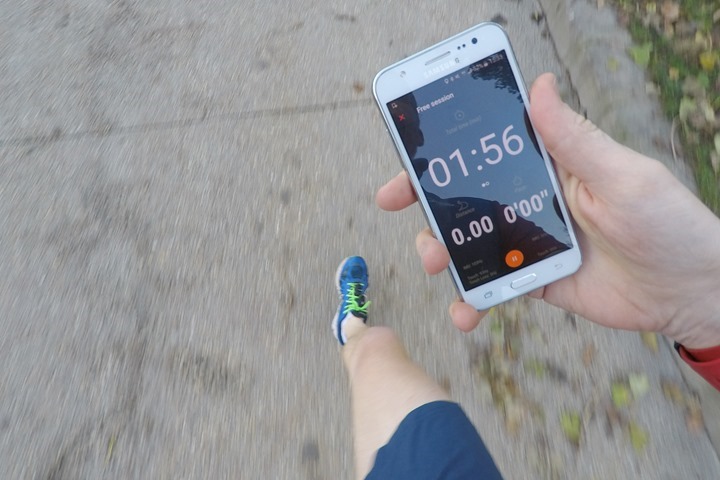
Next, the insoles were paired to their smartphone app. For my test, I was just using a single insole (left) versus a dual set. Though in the last few weeks they’ve implemented the dual functionality. From there I went off for some short 3-4 minute runs, each time varying the pace a bit. Some I’d start off easy and then change to a sprint and so on.
In this particular beta, I had to carry the phone with me (I could have stashed it on a Spibelt or similar), though the next beta and subsequent final versions have storage so that you don’t have to take a phone with you.
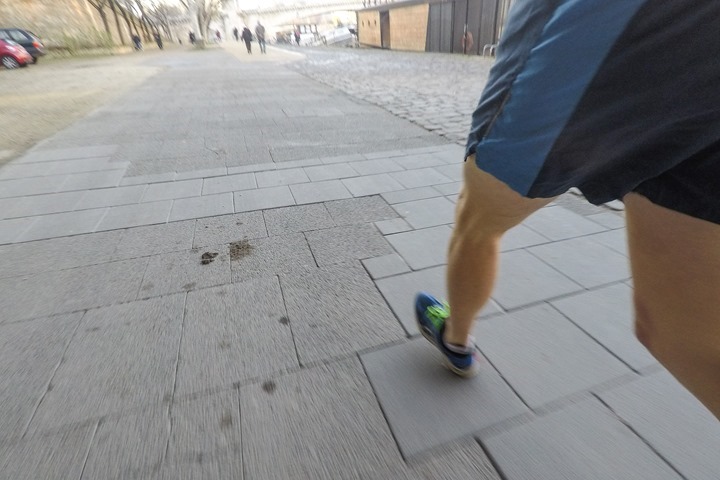
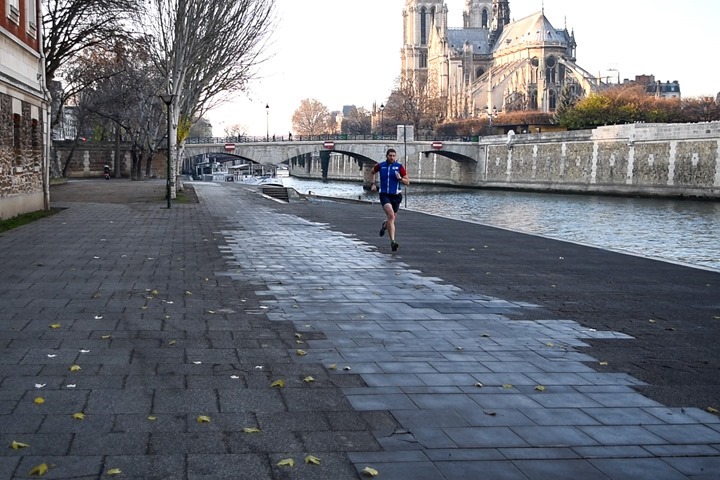
As noted, I also did some sprints back and forth to see how things worked, though unfortunately for some reason the hardware kept dropping the signal when I would kick up the pace (below photo from them, of that). They noted they’ve never seen those dropouts before – even in having done a bunch of track work with higher-end track athletes. Said differently: My running power is just off the charts.
I’m not worried about it at this stage, given it’s beta. That’s what beta is for.
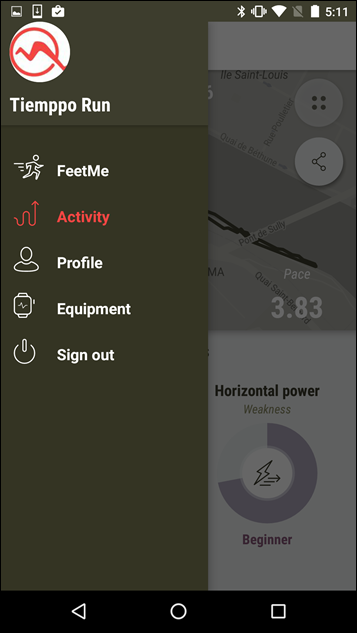
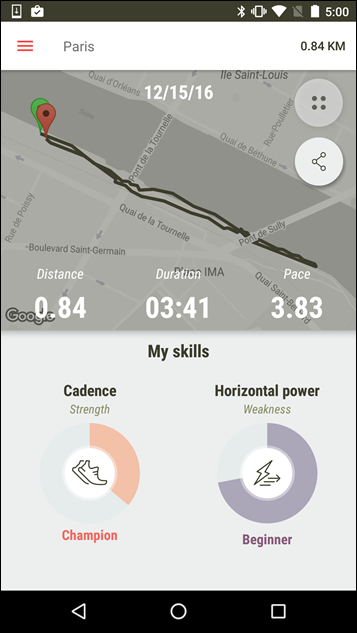
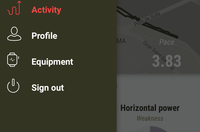
After wrapping up, we headed indoors to check out the data. To begin, we’ve got the menu on the left side for getting around the major parts of the app, while on the right side we have my most recent test run.
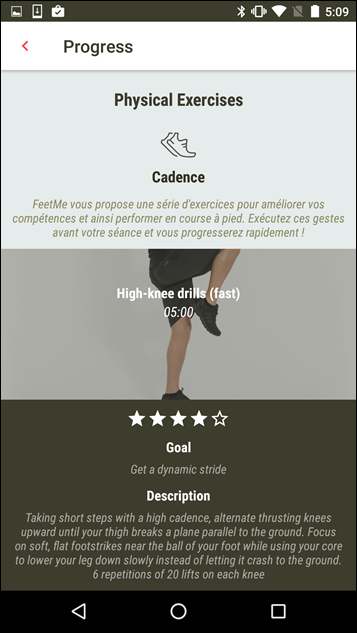
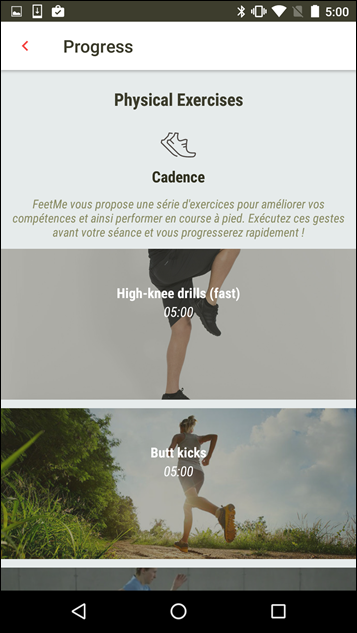
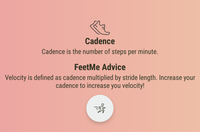
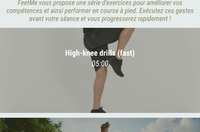
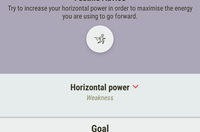
For each run, it’ll get you a slew of data stats from that run. Each of those stats is tied to a specific ‘skill’ that they want you to work on. And in turn, each of those skills has different exercises that you can do to improve it. This is mostly in line with other offerings out in the market. Where both FeetMe and many others have a gap, is backing up the reasoning for each of these skills with specific 3rd party studies that support why they are doing what they are doing.
When I brought this up to FeetMe, they agreed it’d be good to put links to their supporting logic within the app.
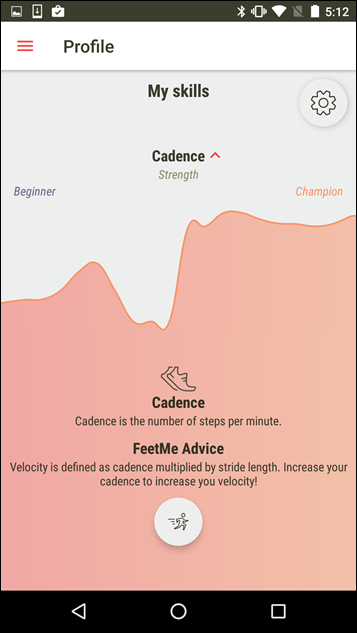
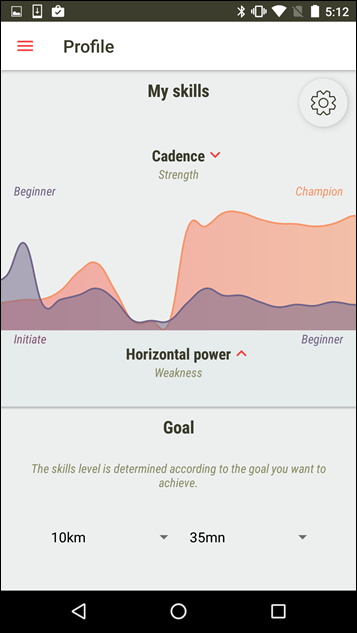
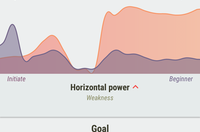
The app will plot your specific skill level, over time, against a broad range of abilities.
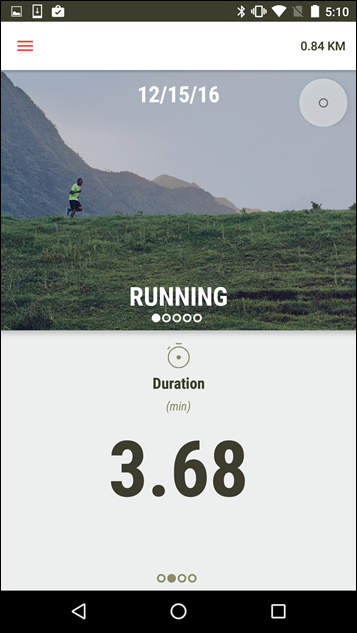
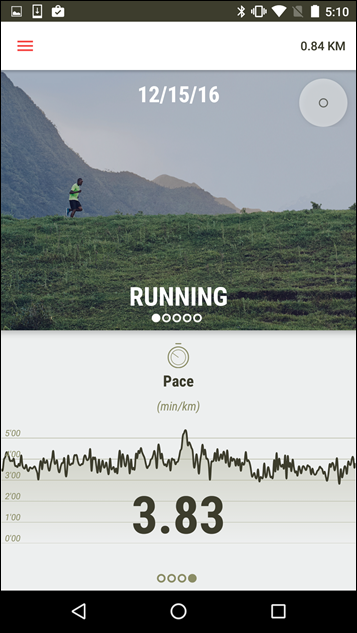
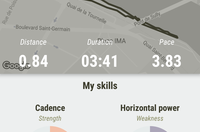
Next, we’ve got basics from my specific run. The first few pages are top-level stats like duration, distance, and pace.
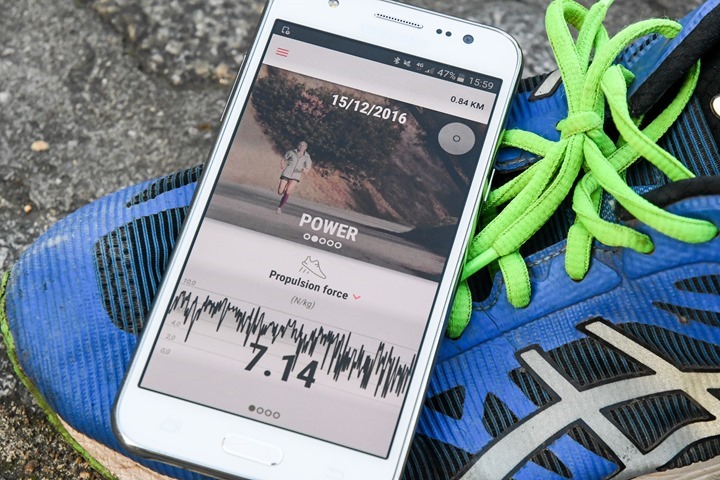
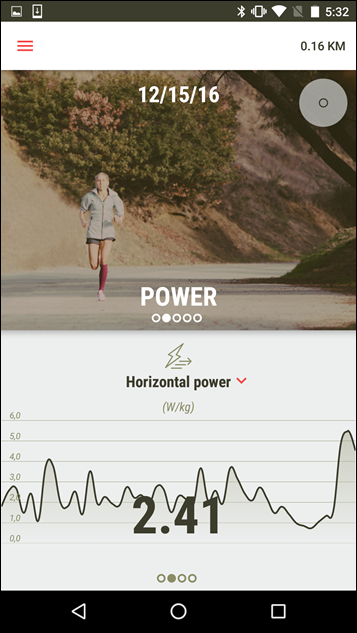
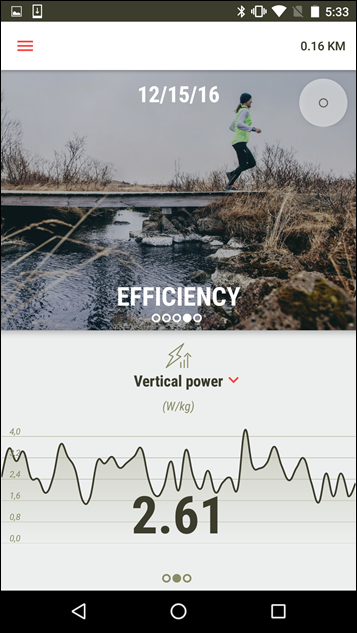
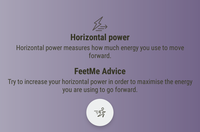
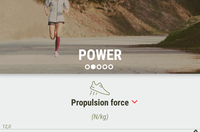
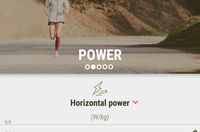
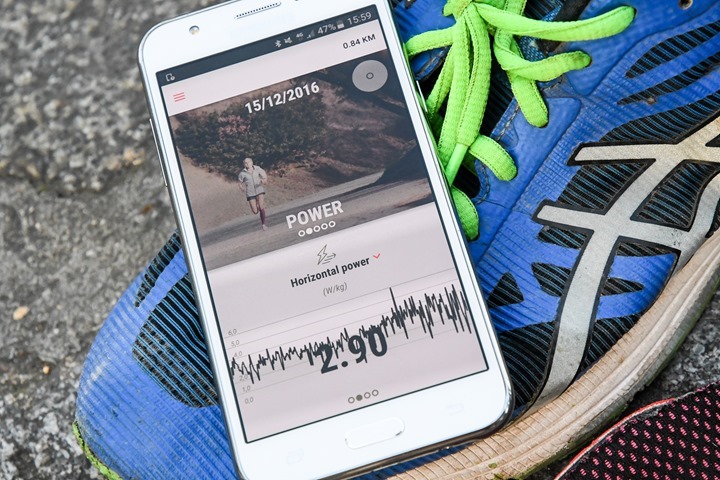
However, as we dig into them, we get more detailed stats – such as a breakout of power. This is done for both vertical power as well as horizontal power. Further, it’s showing it as W/KG, versus just straight watts. Though I argued that for most people – having another page to show watts as well makes it a bit easier to comprehend.
Note at the end of these charts you see that spikes – that’s where I started a sprint (and then broke the unit).
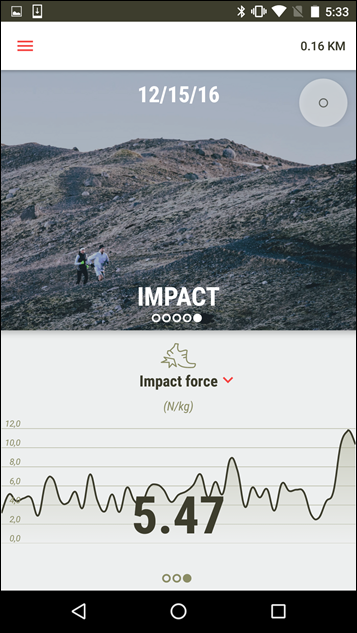
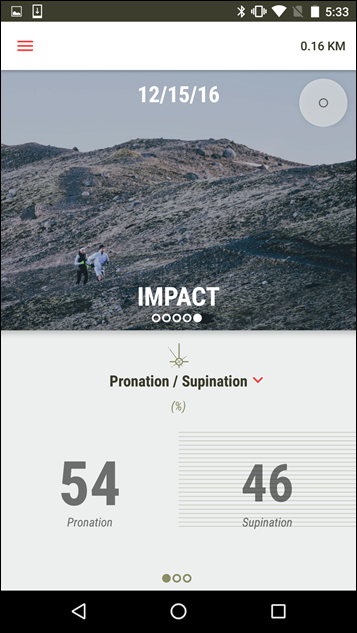
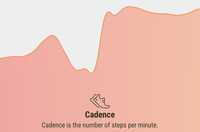
In line with other companies (such as Garmin’s Running Dynamics), you’ve got efficiency metrics like Ground Contact Time, Vertical Oscillation, and of course Cadence. But they go further into areas like Impact Force and Pronation/Supination.
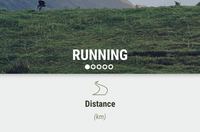
Just to recap a bit on all of the data metrics that the unit can record, here’s a handy listing by the categories they define them in:
Running: Distance, Time, Calories, Pace
Power: Propulsion Force, Horizontal Power, Cadence, Ground Contact Time
Technique: Stride Length, Step Phases (Absorption, Propulsion, Swing), Strike Zone
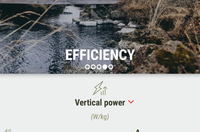
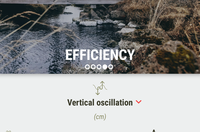
Efficiency: Vertical Power, Vertical Oscillation
Impact: Pronation/Supination, Loading Rate, Impact Force
And to top that off, I had them create a screenshot of every screen in the app (using my run), just to show you virtually all the metrics (albeit on a short run). It’s probably easiest to click on one of the images, and then use the left/right arrows to look at the remainder.
Again remember that you won’t have to use the app during the run in the final version. Instead, the insoles will record the data for later download.
Finally, they plan to sync with major platforms including Garmin, Strava, RunKeeper, and Endomondo. I suspect the sync with Garmin, for example, will mimic what Stryd does, where it imports in your GPS activity file to merge the data from their power app. But those details are still being finalized.
Going Forward:
As I noted earlier on, the running efficiency metrics field is crowded. And it’s largely crowded by startups. Off the top of my head we’ve got RunScribe, Lumo, Kinematix, Wahoo Fitness, SHFT, Evalu Run, and FeetMe. Plus others that are measuring running efficiency at other points, like Garmin with their Running Dynamics. And then there are more companies out there that are promoting product ideas but not yet to the point of having products in hand. And lastly, companies I’ve simply forgotten about.
Some of these companies are already in the segment and have been for a while (Stryd/RunScribe), while others have launched but are still growing to establish an active user base (Kinematix/Lumo). The challenge that all of these companies have though is longevity – and in particular, becoming a ‘needed’ part of your daily workout.
Like any other device you buy – if it’s just geekery for geekness sake, it’s not likely to be something you use long term. For me, Garmin’s Running Dynamics fall into that category. Years later, there’s really nothing that’s been done and validated from a science training standpoint to indicate how to use the data for training or racing. Thus, I ignore it. Companies doing running power will need to find similar validation as well, though their job is a bit easier on the running power theory part. The trickier part for running power companies is accuracy of data.
And that’s where FeetMe could be in a better position than others. Since FeetMe is actually measuring your running propulsion force, it’s actually a true running power meter. In theory, it should be able to show the difference between running into a headwind vs with a tailwind. Something that accelerometer based solutions like Stryd are unable to do today.
Further, with that sensor platform – it gives FeetMe more flexibility in terms of data measurements. Not only that, but they’ve got effectively the same IMU (accelerometer/gyroscope/magnetometer) system as most other footpods. So they kinda double-down in that region.
I see FeetMe’s biggest challenge though is data compatibility. Most serious runners aren’t going to want to use FeetMe’s app to do training log analysis, but rather will turn to companies like Training Peaks and Sport Tracks. Yet those platforms are only in the beginnings of supporting running power, and in many ways – that is in turn dependent on watch companies like Garmin, Suunto and Polar working to make it easier to consume running power data. To date, only Suunto has done so. Garmin supports it via Connect IQ – but then apps like TrainingPeaks don’t bother to support that data. Thus…sigh.
But all that’s a discussion for a different post on a different day.
In the meantime, you can pre-order the FeetMe units on their site, and they plan to start delivering later in June. The official retail price is 249EUR, though on their site they’ve got a pre-order 100EUR off deal – bringing it down to 149EUR (quite reasonable). And again, yes, that’s for two insoles. You’ll just need to pick your shoe size.
Once they get closer to release I’ll likely give them another whirl. I’d be particularly interested to see how they compare to Stryd from a running power standpoint, as well as the other metrics they overlap in.
Thanks for reading!


